Redesigned Test Analysis for
Better Learning Outcomes

Redesigned Test Analysis for
Better Learning Outcomes

Increased engagement by 30%

Increased engagement by 30%

About the company

About the company

Aakash

Aakash is a India’s biggest edtech platform specializing in preparing students for (NEET) and (JEE) entrance exams,

Aakash is a India’s biggest edtech platform specializing in preparing students for (NEET) and (JEE) entrance exams,

3M+

Students trained

5,000+

5,000+

Partners

Partners

300+

Branches (India)

My Role

End-to-end, Product Designer

My role spanned across,

User & business Research

Wireframing

Hi-fi Designs

Prototyping

Usability Testing

Cross-functional collaboration

My role spanned across,

User & business Research

Wireframing

Hi-fi Designs

Prototyping

Usability Testing

Cross-functional collaboration

Project Details

Project Details

Timeline

1 Month

(Jan 2025)

The Team

1 PM, 2 Developers,

1 Designer

Business context

Business context

Test completion was high, post-test learning behavior was weak.

The platform observed that while a large no of students completed tests, only a small portion engaged with test analysis.


This limited learning outcomes and contributed to lower retention

70-80%

Test completion rate

20-30%

Test analysis visit rate

10-20%

Repeat analysis usage

Why It’s Important for Business

The need

Test analysis is the bridge between performance and retention, if students don't improve confidence drops and churn rate increases

Lower analysis enagement

Lower analysis enagement

Lower improvement

Text

Text

Lower student retention

Higher churn rate

Business objective

Business objective

“How can we increase test analysis enagagement and strengthen student learning to reduce churn rate

Research

Research

To understand the gaps in the existing test analysis experience, I conducted a combination of

To understand the gaps in the existing test analysis experience, I conducted a combination of

UX Audit

Reviewed the current analysis

Task-Based Usability Research

Reviewed the current analysis

Quantitative Research

Click patterns on different tabs

Task Based Usability Research

Students were asked to interact with the product, enabling observation of Navigation patterns, Decision-making behavior patterns and friction points

Observation 1

Understand Overall Performance

Students perceive score as the primary indicator of performance and do not feel the need to explore deeper analysis unless prompted

Observation 2

Identify Weak Areas

Students expressed confusion about where to find weaknesses and switched between multiple tabs

Task 3

Decide What to Do Next

Students gave vague responses and ere unable to define a clear next step

Task 4

Analyze Mistakes in Detail

Student navigated to question analysis and found list overwhelming

Task 5

Use Comparative Analysis

Students said it was interesting but not useful and could not derive any actionable insight

Task 6

Review Answer Key & Solutions

Students focused only on correctness right/wrong and exited

User Interviews

User Interviews

Quantitative Insights

High Drop-off After Initial View

A significant portion of users exit after viewing score and summary-level data.

High Drop-off After Initial View

A significant portion of users exit after viewing score and summary-level data.

Low Engagement with Deep Analysis

Chapter and comparative analysis had low engagement

Low Engagement with Deep Analysis

Chapter and comparative analysis had low engagement

Limited Cross-Section Navigation

Users rarely explore multiple sections in a single session

Limited Cross-Section Navigation

Users rarely explore multiple sections in a single session

Low Repeat Visits

Majority students focused only on score and rank

Low Repeat Visits

Majority students focused only on score and rank

Key Problems

Key Problems

Major problem buckets

Major problem buckets

After going through the app and interviews, problems can be categorised into these major buckets

After going through the app and interviews, problems can be categorised into these major buckets

Problem 1

Score-Centric Behavior Dominates

Students primarily focus on score and rank

Problem 1

Score-Centric Behavior Dominates

Students primarily focus on score and rank

Problem 2

Lack of Guided Flow

The experience does not provide a structured path, leading to random navigation across tabs

Problem 2

Lack of Guided Flow

The experience does not provide a structured path, leading to random navigation across tabs

Problem 3

High Cognitive Load

Multiple sections, dense data, and repeated patterns increase mental effort

Problem 3

High Cognitive Load

Multiple sections, dense data, and repeated patterns increase mental effort

Problem 4

Weak Actionability

Students struggle to convert analysis into concrete actions

Problem 4

Weak Actionability

Students struggle to convert analysis into concrete actions

Problem Discovery

Problem Discovery

Students were able to access detailed performance data, but were unable to interpret it or translate it into meaningful actions

Students were able to access detailed performance data, but were unable to interpret it or translate it into meaningful actions

The system optimized for data availability, but failed at data interpretation and guidance

The system optimized for data availability, but failed at data interpretation and guidance

Solution 1

Solution 1

Design Realization

Initial exploration focused on:

  • Improving layout

  • Restructuring information

  • Enhancing visual hierarchy

Initial exploration focused on:

  • Improving layout

  • Restructuring information

  • Enhancing visual hierarchy

The problem was not a UI problem, it was a cognition and interpretation problem


To solve this, the system needed to:

  • Reduce interpretation effort

  • Surface meaningful patterns

  • Guide users toward action

The problem was not a UI problem, it was a cognition and interpretation problem


To solve this, the system needed to:

  • Reduce interpretation effort

  • Surface meaningful patterns

  • Guide users toward action

Business objective

Business objective

“How can we increase test analysis enagagement and strengthen student learning to reduce churn rate
Solution 2

Solution 2

Low inventory prediction & it’s nudges

Low inventory prediction & it’s nudges

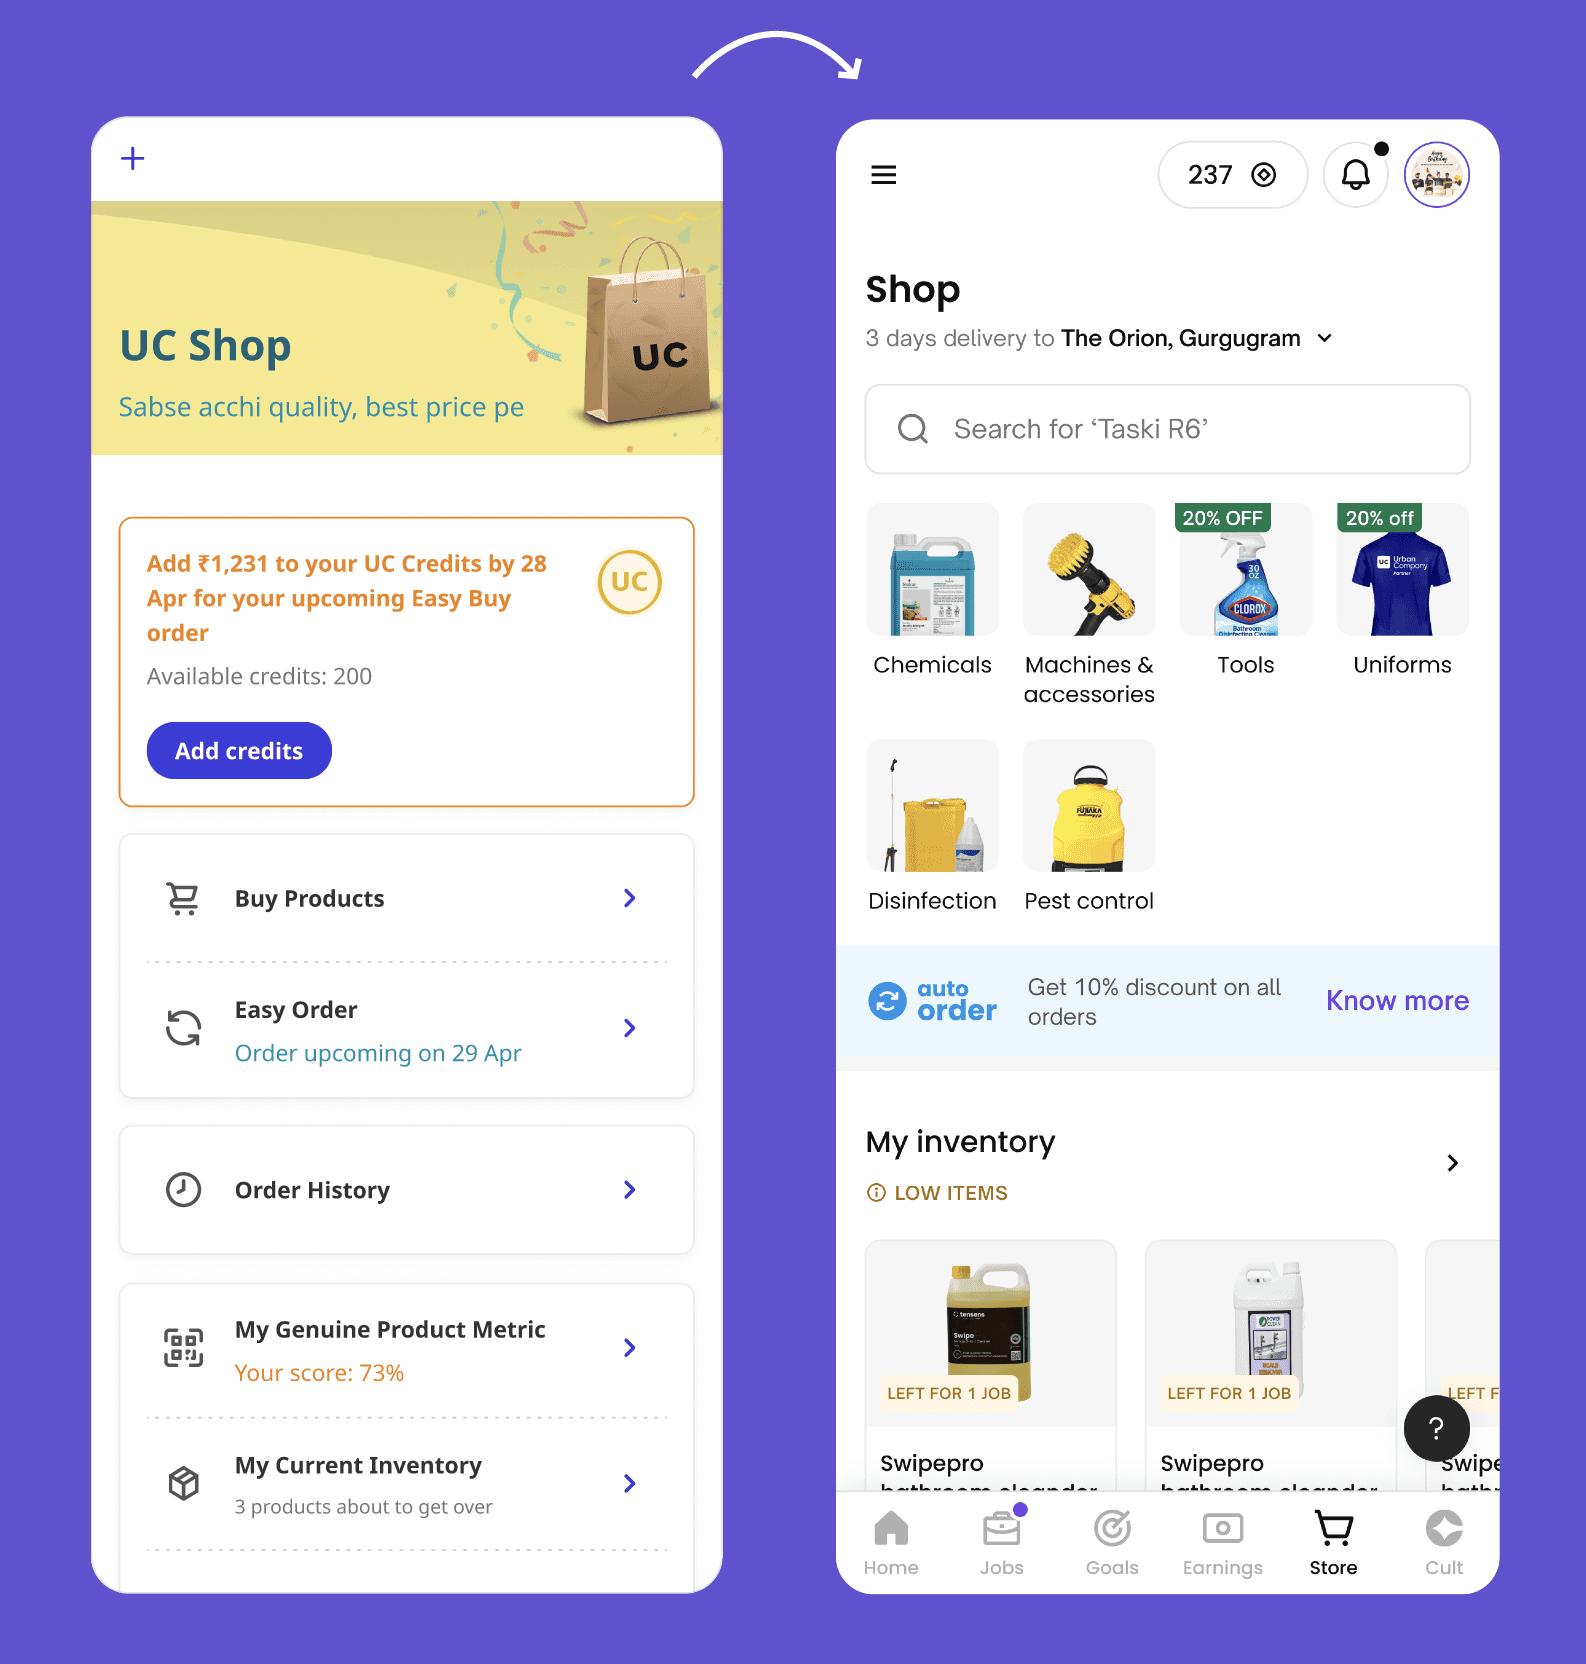
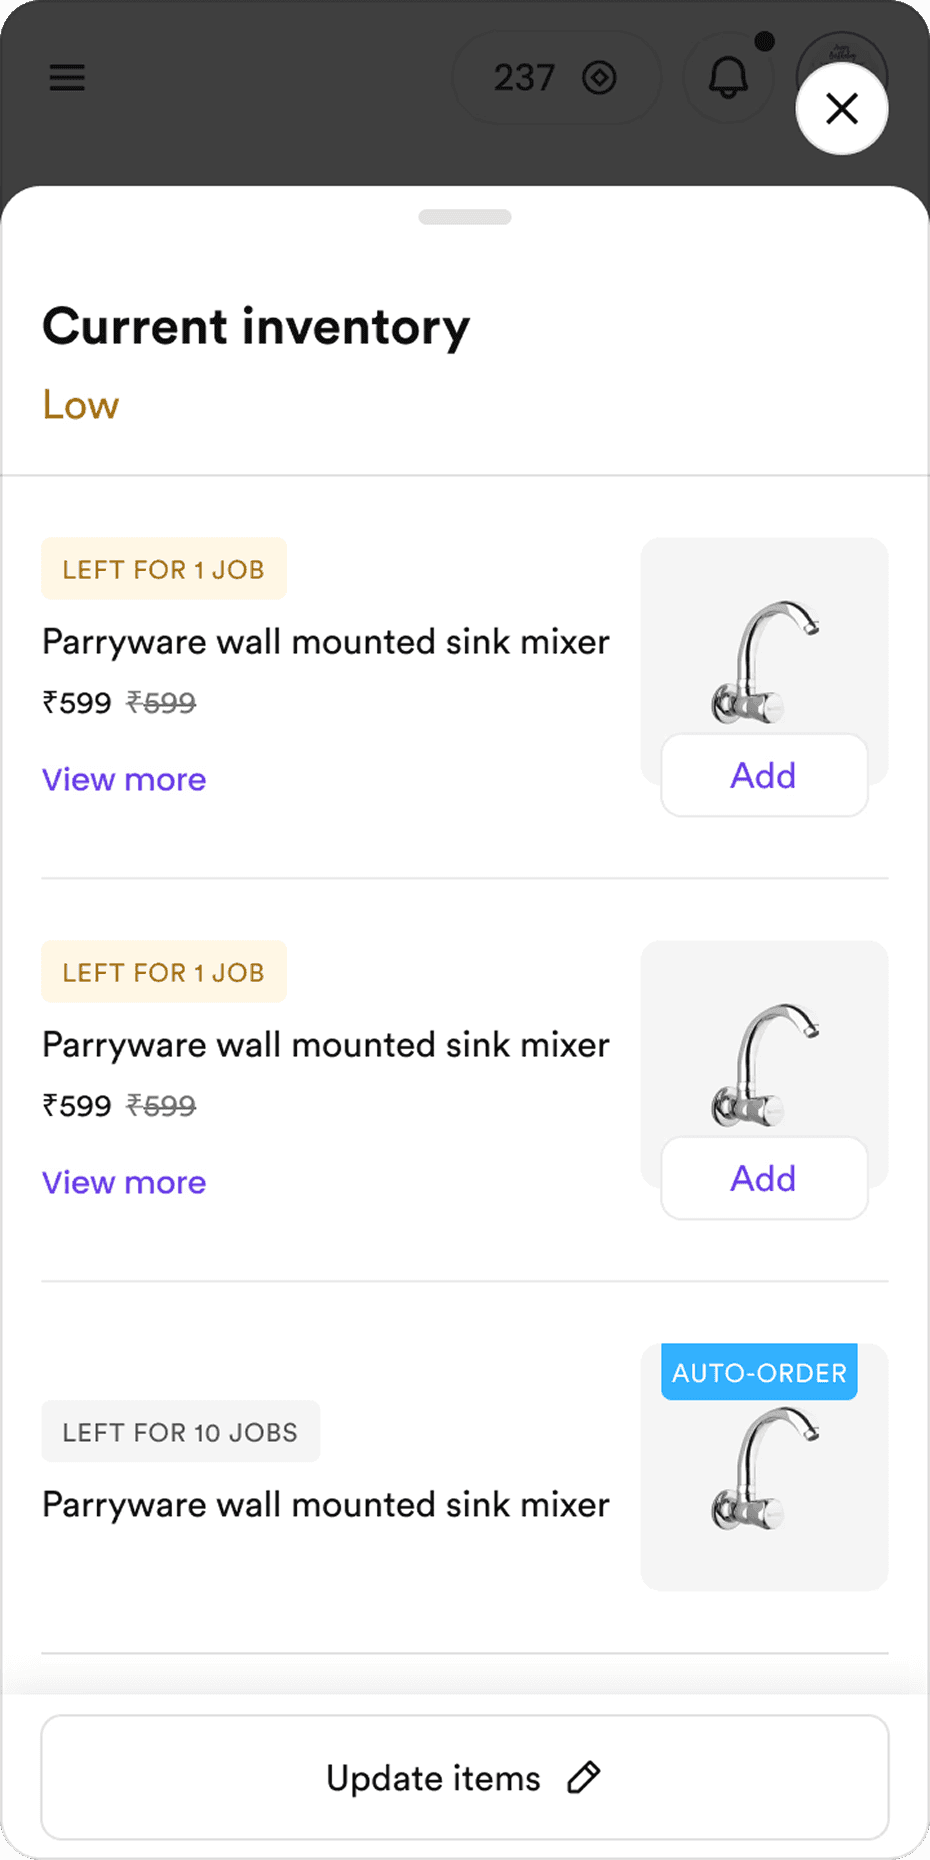
We introduced predictive low-inventory signals to help partners stay ahead of demand. Using a high-accuracy model, the system flags items at risk and nudges partners at the right moment.

Timely notifications make replenishment proactive instead of reactive.

We introduced predictive low-inventory signals to help partners stay ahead of demand. Using a high-accuracy model, the system flags items at risk and nudges partners at the right moment.

Timely notifications make replenishment proactive instead of reactive.

Algo predicts low inventory with 90% accuracy

Algo predicts low inventory with 90% accuracy

Notifications are sent to partners when low on inventory

Notifications are sent to partners when low on inventory

67%

67%

Low inventory nudge adoption

Low inventory nudge adoption

Solution 2 - Low inventory nudge on Homepage

Solution 2 - Low inventory nudge on Homepage

Solution 2 - Low inventory nudge on UC Store

Solution 2 - Low inventory nudge on UC Store

Solution 3

Solution 3

Smart inventory

Smart inventory

We have developed a smart system that eliminates manual effort from everyday operations. Automation handles inventory counts, low-stock nudges, and even auto-ordering at the right time. Stock checks are triggered naturally as jobs complete, keeping data fresh without extra work. By prioritizing low-stock items, partners stay prepared and avoid last-minute shortages.

We have developed a smart system that eliminates manual effort from everyday operations. Automation handles inventory counts, low-stock nudges, and even auto-ordering at the right time. Stock checks are triggered naturally as jobs complete, keeping data fresh without extra work. By prioritizing low-stock items, partners stay prepared and avoid last-minute shortages.

Replaced manual labour with automation, like inventory counts, low inventory nudges & auto ordering

Replaced manual labour with automation, like inventory counts, low inventory nudges & auto ordering

Asking for re-filling inventory when every job completes

Asking for re-filling inventory when every job completes

Higher priority to low stock items

Higher priority to low stock items

+46%

+46%

“Add to cart” CTR from low inventory

“Add to cart” CTR from low inventory

Solution 3 - Smart inventory

Solution 3 - Smart inventory

Solution 4

Solution 4

Auto-order cart

Auto-order cart

Orders automatically when inventory is low for subscribed items

Orders automatically when inventory is low for subscribed items

Savings focused, extra discounts

Savings focused, extra discounts

Improved visibility, easy subscription

Improved visibility, easy subscription

Removes manual labour of tracking & ordering inventory

Removes manual labour of tracking & ordering inventory

+12%

+12%

Auto-order adoption

Auto-order adoption

Solution 4 - Subscribing items for auto-order

Solution 4 - Subscribing items for auto-order

Solution 5

Solution 5

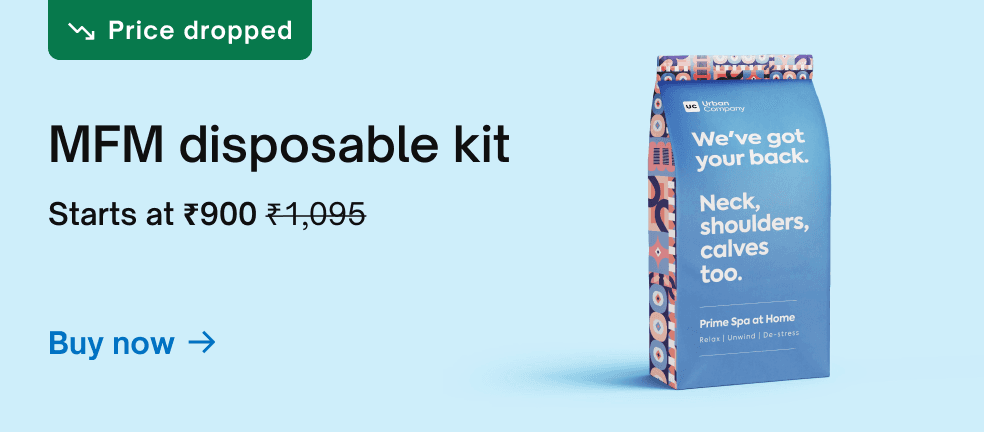
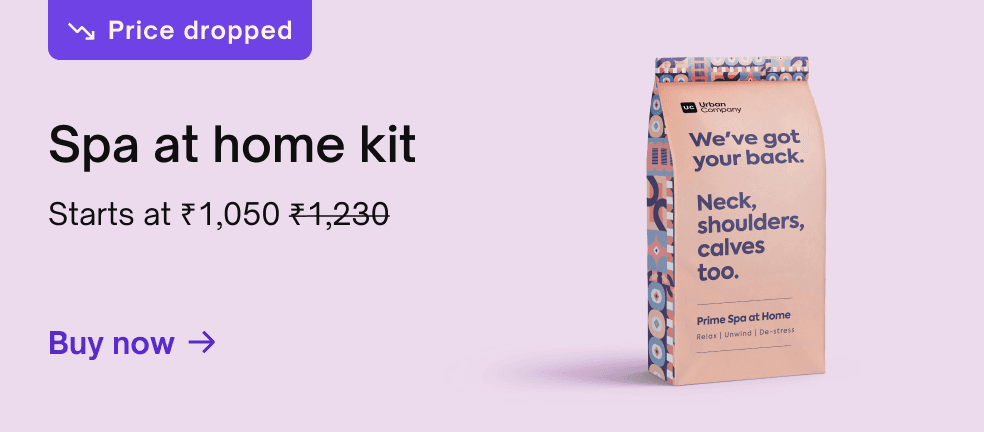
Making promos & discounts more prominent

Making promos & discounts more prominent

Used the new banner guidelines from ADS which focused on minimalism and clear value proposition. We also,

Used the new banner guidelines from ADS which focused on minimalism and clear value proposition. We also,

Increased sales campaigns

Increased sales campaigns

2x increase in promotion frequency

2x increase in promotion frequency

2.2x

2.2x

Promo notification CTR

Promo notification CTR

Solution 5 - New banners

Solution 5 - New banners

Solution 6

Solution 6

Increasing awareness & visibility

Increasing awareness & visibility

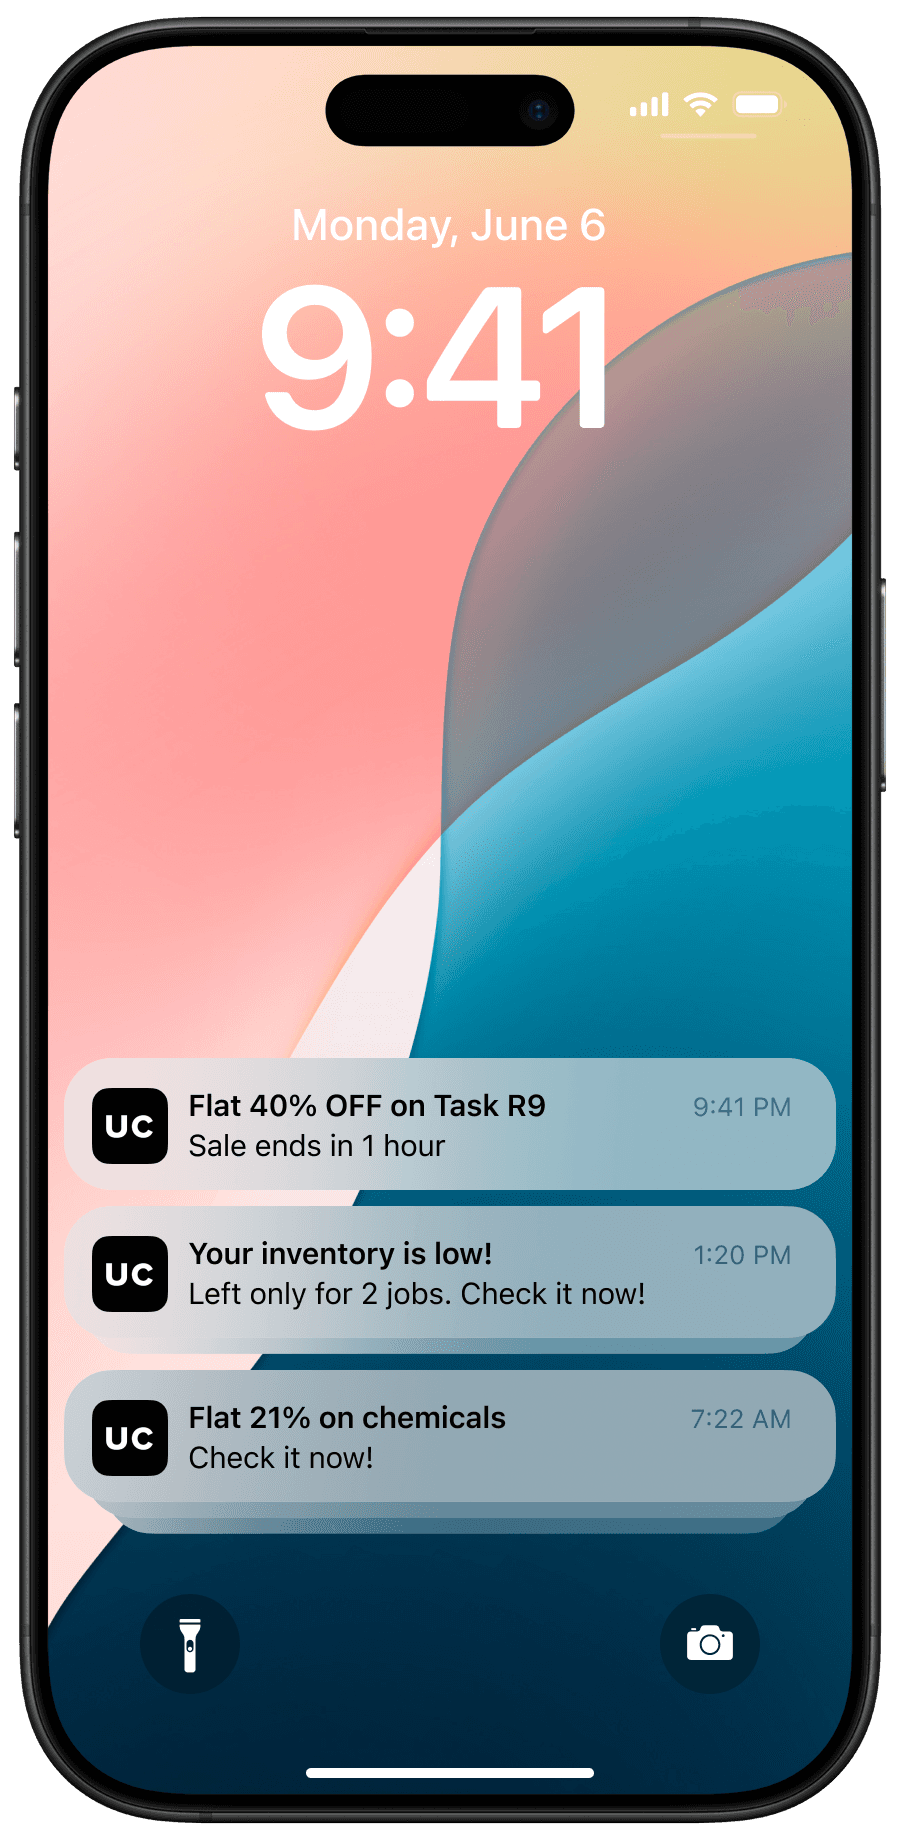
2x increase in frequency of push notifications related to discount/ promo campaigns

2x increase in frequency of push notifications related to discount/ promo campaigns

2x increase in low inventory item nudges

2x increase in low inventory item nudges

Improved footprint of low inventory items

Improved footprint of low inventory items

2.2x

2.2x

Promo notification CTR

Promo notification CTR

Solution 6 - More notifications

Solution 6 - More notifications

Summary

Summary

Impact overview

Impact overview

Launched in all 4 countries, we tracked Q3 2022 and received promising results

Launched in all 4 countries, we tracked Q3 2022 and received promising results

+27%

+27%

Product adoption (From xx% to xx%)

Product adoption (From xx% to xx%)

+0.02pp

+0.02pp

Customer ratings (From 4.75 to 4.77)

Customer ratings (From 4.75 to 4.77)

+50%

+50%

Adoption in salon category

~8%

~8%

Auto-order adoption increased

-12%

-12%

Order related support tickets

And the most important solution, we

And the most important solution, we

Revamped the homepage

Revamped the homepage

A/B tested 3 homepage variants

A/B tested 3 homepage variants

With 5% user base in 2 cities (Delhi and Bangalore)

With 5% user base in 2 cities (Delhi and Bangalore)

Control group

Control group

Linear architect

Linear architect

Order of the sections was buying flow, inventory tracking, auto-order, order tracking, promotions, value props

Order of the sections was buying flow, inventory tracking, auto-order, order tracking, promotions, value props

Decent engagement over categories

Decent engagement over categories

Low inventory had average results

Low inventory had average results

Auto-order lowest adoption

Auto-order lowest adoption

Variant A

Variant A

Focuses on low inventory

Focuses on low inventory

Order of the sections was buying flow, inventory tracking, auto-order, order tracking, promotions, value props

Order of the sections was buying flow, inventory tracking, auto-order, order tracking, promotions, value props

Low inventory had better conversion

Low inventory had better conversion

Highest Auto-order adoption

Highest Auto-order adoption

Highest purchase via categories

Highest purchase via categories

Variant B

Variant B

Segregated architechture (Tracking + Buying)

Segregated architechture (Tracking + Buying)

Tracking (Inventory, Orders, Auto-orders)

Tracking (Inventory, Orders, Auto-orders)

Buying (Purchase journey, Promotions, Value Props)

Buying (Purchase journey, Promotions, Value Props)

Focused more on buying

Focused more on buying

Tracking had low engagement

Tracking had low engagement

Lowest promotion adoption

Lowest promotion adoption

A/B Conclusion

A/B Conclusion

We choose higher engagement features and launched the new homepage

We choose higher engagement features and launched the new homepage

Highest engagement & conversion

Highest engagement & conversion

Stronger promotional lift

Stronger promotional lift

Displaying “Low items in inventory” directly under the SKU grid alerts partners before stockouts, reducing emergency orders.

Displaying “Low items in inventory” directly under the SKU grid alerts partners before stockouts, reducing emergency orders.

Final designs

Final designs

This is what it looked like after the designs.

This is what it looked like after the designs.

Intro banner

Intro banner

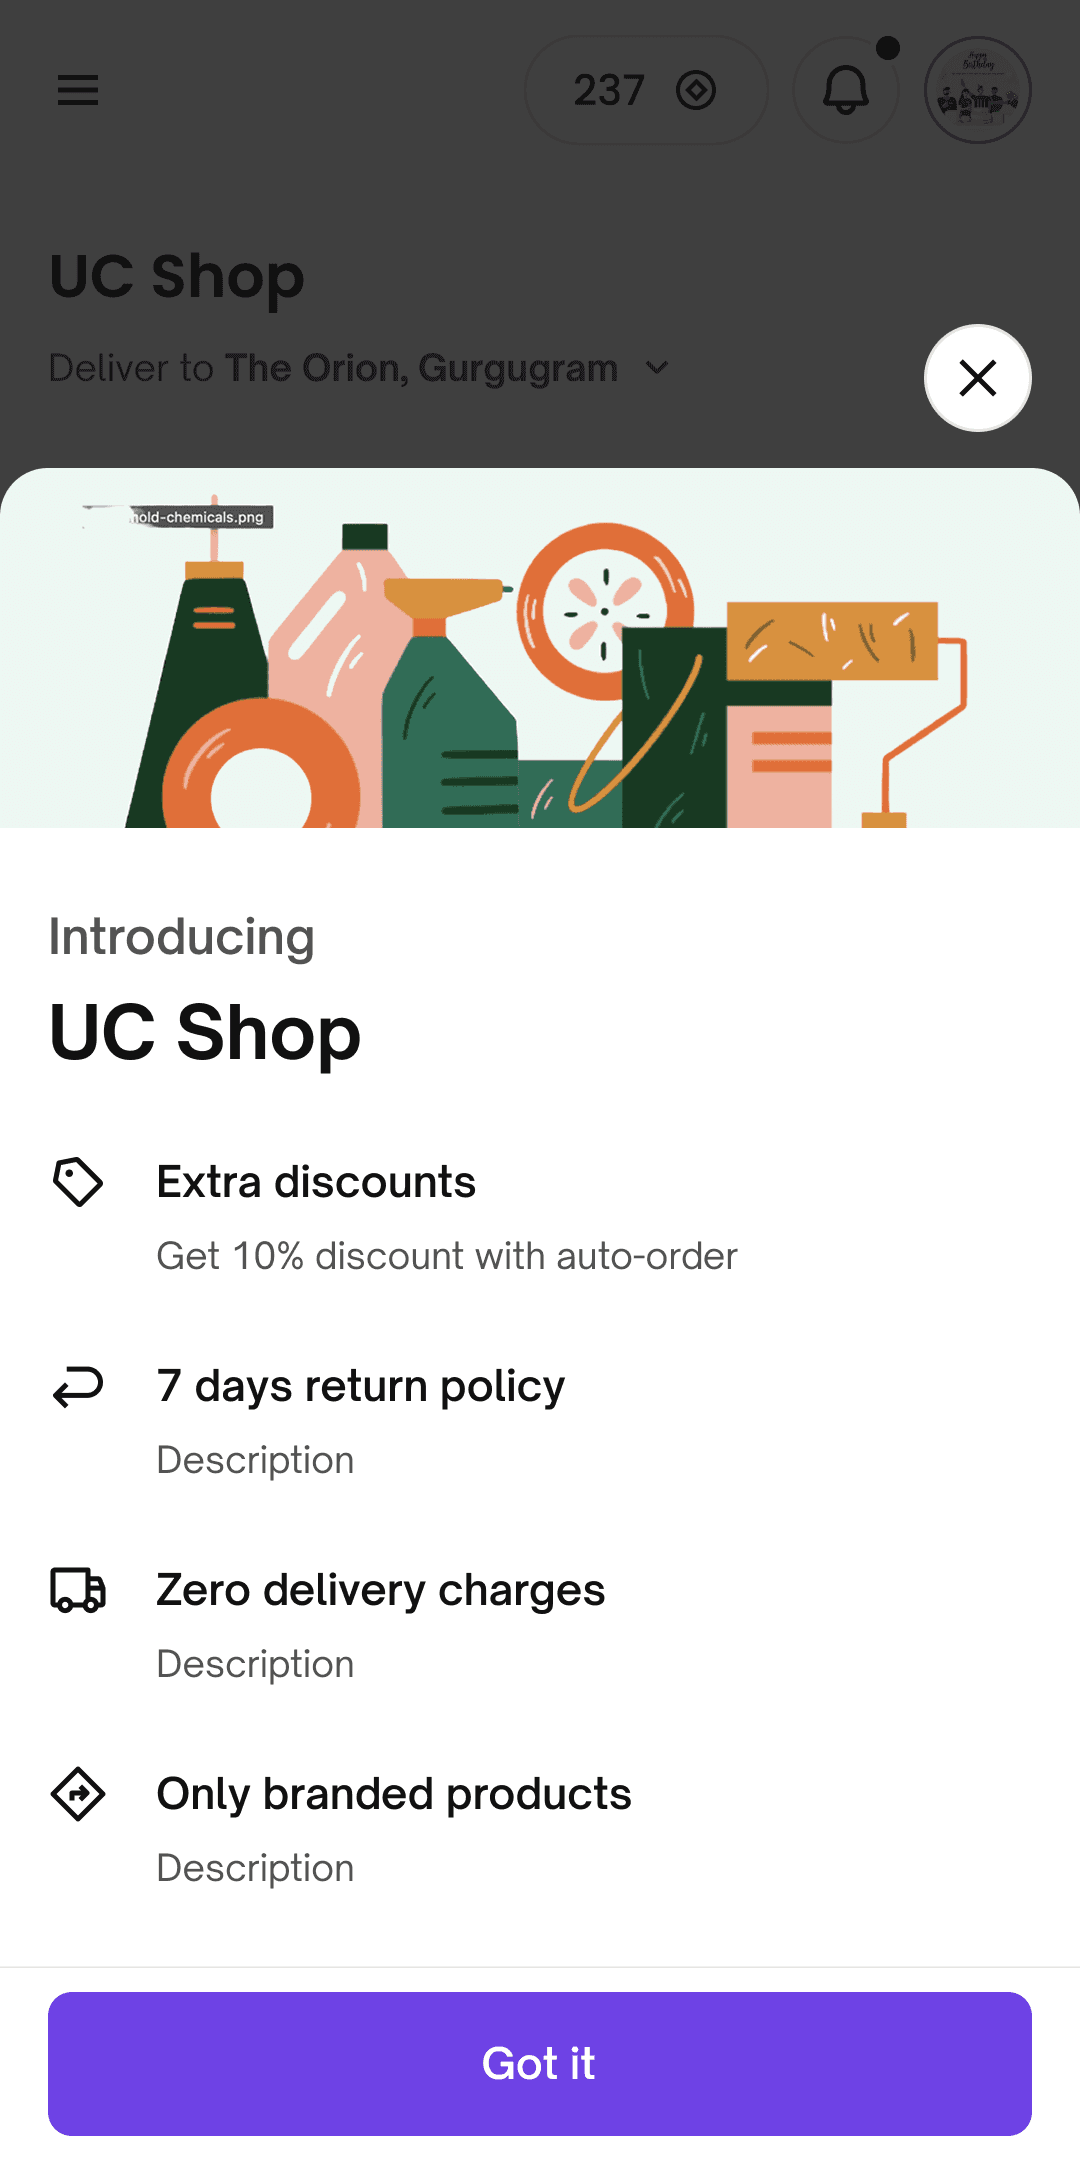
Puts value props infront of the user

Puts value props infront of the user

New Homepage

New Homepage

Focuses most on buying and low inventory

Focuses most on buying and low inventory

Order tracking

Order tracking

Easy order tracking & refund processing

Easy order tracking & refund processing

Auto-order

Auto-order

Auto-order enforcing before going to cart

Auto-order enforcing before going to cart

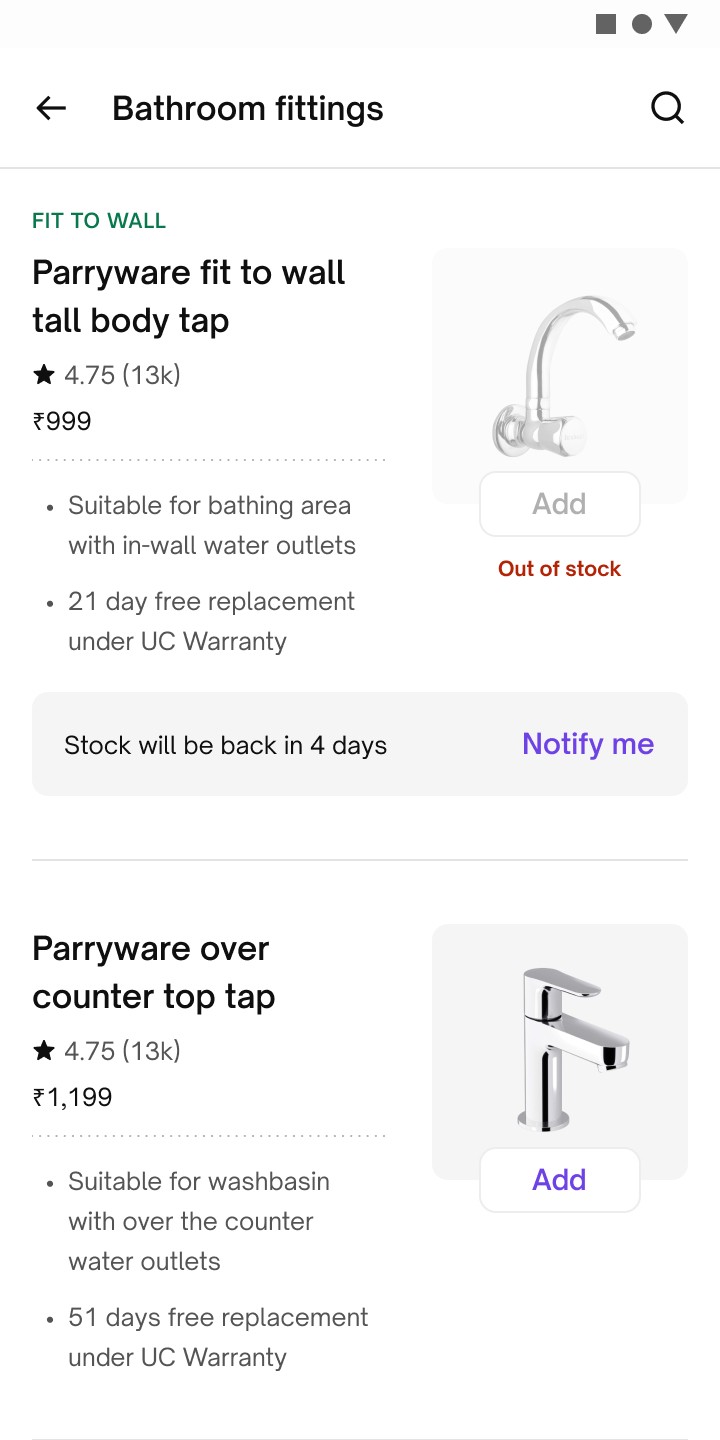
Out of stock items

Out of stock items

Put a reminder when stock is back

Put a reminder when stock is back

SKU Details

SKU Details

Clarity, trust, transparency in details

Clarity, trust, transparency in details

Impact

Impact

Impact

Impact

Launched in all 4 countries, we tracked Q3 2022 and received promising results

Launched in all 4 countries, we tracked Q3 2022 and received promising results

+27%

+27%

Product adoption (From xx% to xx%)

Product adoption (From xx% to xx%)

+0.02pp

+0.02pp

Customer ratings (From 4.75 to 4.77)

Customer ratings (From 4.75 to 4.77)

+50%

+50%

Adoption in salon category

~8%

~8%

Auto-order adoption increased

-12%

-12%

Order related support tickets

Future roadmap

Future roadmap

Product adherence

Product adherence

We want to increase product adherence using proof of work to make sure partner is using good products and customer experience is not compromised.

We want to increase product adherence using proof of work to make sure partner is using good products and customer experience is not compromised.

Learnings

Learnings

Familiarity is the biggest blind spot

Familiarity is the biggest blind spot

When I looked at the system like a first-time user, I noticed flows that technically worked but felt mentally heavy. Fresh eyes helped separate what functions from what actually feels obvious, and that was the biggest learning

When I looked at the system like a first-time user, I noticed flows that technically worked but felt mentally heavy. Fresh eyes helped separate what functions from what actually feels obvious, and that was the biggest learning

The End

The End

Thank you for your time

Thank you for your time

If you feel like chatting about the case study, drop me a Hi! I reply in seconds.

If you feel like chatting about the case study, drop me a Hi! I reply in seconds.

JUMP TO

JUMP TO

Create a free website with Framer, the website builder loved by startups, designers and agencies.